How It Works
The System Explained
A short overview of the system and the Conditional Pick-4
"RP-Excel" System Overview
"Conditional" Pick-4 Explained
"t-selections" Analysis
Analysis Methodology
The race analysis in these reports is generated using advanced statistical and computational techniques. Multiple large historical databases are processed with Neural Networks, Genetic Algorithms, and Monte Carlo Simulations. The modeling is performed with professional-grade software tools, including Statistica, Risk Solver Platform, NeuroSolutions for Excel, and Evolver.
Educational Guidance on Applying the Analysis (For Learning Purposes Only)
The probability estimates and performance metrics provided in the reports can be used as inputs for various theoretical combination-reduction techniques, such as the Conditional Sequence Method described earlier. These methods allow users to explore how different conditions affect the total number of combinations while keeping the same set of outcomes under consideration.
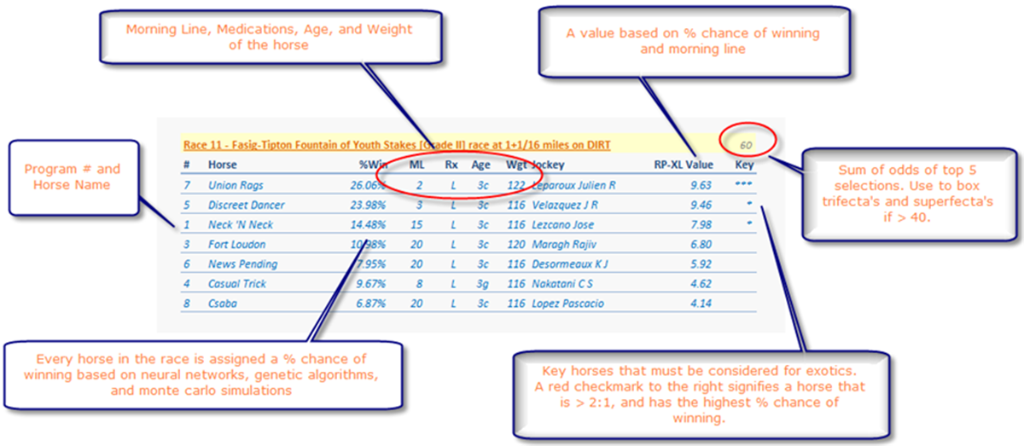
For single-race analysis, the RP-XL Value column can serve as one example of a data-driven metric for educational simulations and decision modeling.
All analysis and examples in this report are based on fast-track conditions unless otherwise noted.
Sample Race
Santa Anita Park — Sunday, February 26, 2012: Race 11 · (7) Union Rags wins the Fountain Of Youth